
Prometheus MCP Server
Seamlessly connect AI assistants to Prometheus for real-time monitoring, automated analytics, and DevOps insights with the Prometheus MCP Server.

What does “Prometheus” MCP Server do?
The Prometheus MCP Server is a Model Context Protocol (MCP) implementation that enables AI assistants to interact with Prometheus metrics using standardized interfaces. By acting as a bridge between AI agents and Prometheus, it allows for seamless execution of PromQL queries, discovery and exploration of metric data, and provides direct access to time-series analytics. This empowers developers and AI tools to automate monitoring, analyze infrastructure health, and gain operational insights without manual data retrieval. Key features include metric listing, metadata access, support for both instant and range queries, and configurable authentication (basic auth or bearer token). The server is also containerized for easy deployment and can be flexibly integrated with various AI development workflows.
List of Prompts
No information about prompt templates is provided in the repository.
List of Resources
No explicit resources (as defined by MCP) are listed in the repository.
List of Tools
- Execute PromQL queries: Enables clients to run PromQL queries directly against the Prometheus server.
- List available metrics: Allows enumeration of all metrics present in the Prometheus instance.
- Get metadata for metrics: Provides detailed metadata for a specific metric, supporting contextual analysis.
- View instant query results: Retrieves real-time (instant) values for specific Prometheus metrics.
- View range query results: Fetches metric values over a specified time range with various step intervals.
Use Cases of this MCP Server
- Automated Infrastructure Monitoring: AI assistants can query Prometheus to check health and performance indicators, automating alerting and anomaly detection.
- DevOps Analytics: Developers can use the server to analyze historical trends, usage patterns, and resource bottlenecks.
- Incident Triage: When incidents occur, AI agents can pull relevant metric snapshots and time ranges to assist in root cause analysis.
- Custom Dashboard Generation: Programmatically fetch metrics and metadata to create or update dashboards integrated with AI-driven insights.
- Security and Compliance Auditing: Use querying capabilities to gather metrics relevant for compliance checks and reporting, all automated through AI workflows.
How to set it up
Windsurf
No specific instructions are provided for Windsurf in the repository.
Claude
- Ensure your Prometheus server is accessible from the deployment environment.
- Configure environment variables for Prometheus (e.g.,
PROMETHEUS_URL, credentials). - In Claude Desktop, add the server configuration to your
mcpServersobject:{ "mcpServers": { "prometheus": { "command": "uv", "args": [ "--directory", "<full path to prometheus-mcp-server directory>", "run", "src/prometheus_mcp_server/main.py" ], "env": { "PROMETHEUS_URL": "http://your-prometheus-server:9090", "PROMETHEUS_USERNAME": "your_username", "PROMETHEUS_PASSWORD": "your_password" } } } } - Save the configuration and restart Claude Desktop.
- Verify that the Prometheus server is listed and accessible.
Note: If you see Error: spawn uv ENOENT, specify the full path to uv or set the environment variable NO_UV=1 in the configuration.
Cursor
No specific instructions are provided for Cursor in the repository.
Cline
No specific instructions are provided for Cline in the repository.
Securing API Keys
Sensitive values such as API keys, usernames, and passwords should be set via environment variables.
Example (in JSON configuration):
"env": {
  "PROMETHEUS_URL": "http://your-prometheus-server:9090",
  "PROMETHEUS_USERNAME": "your_username",
  "PROMETHEUS_PASSWORD": "your_password"
}
How to use this MCP inside flows
Using MCP in FlowHunt
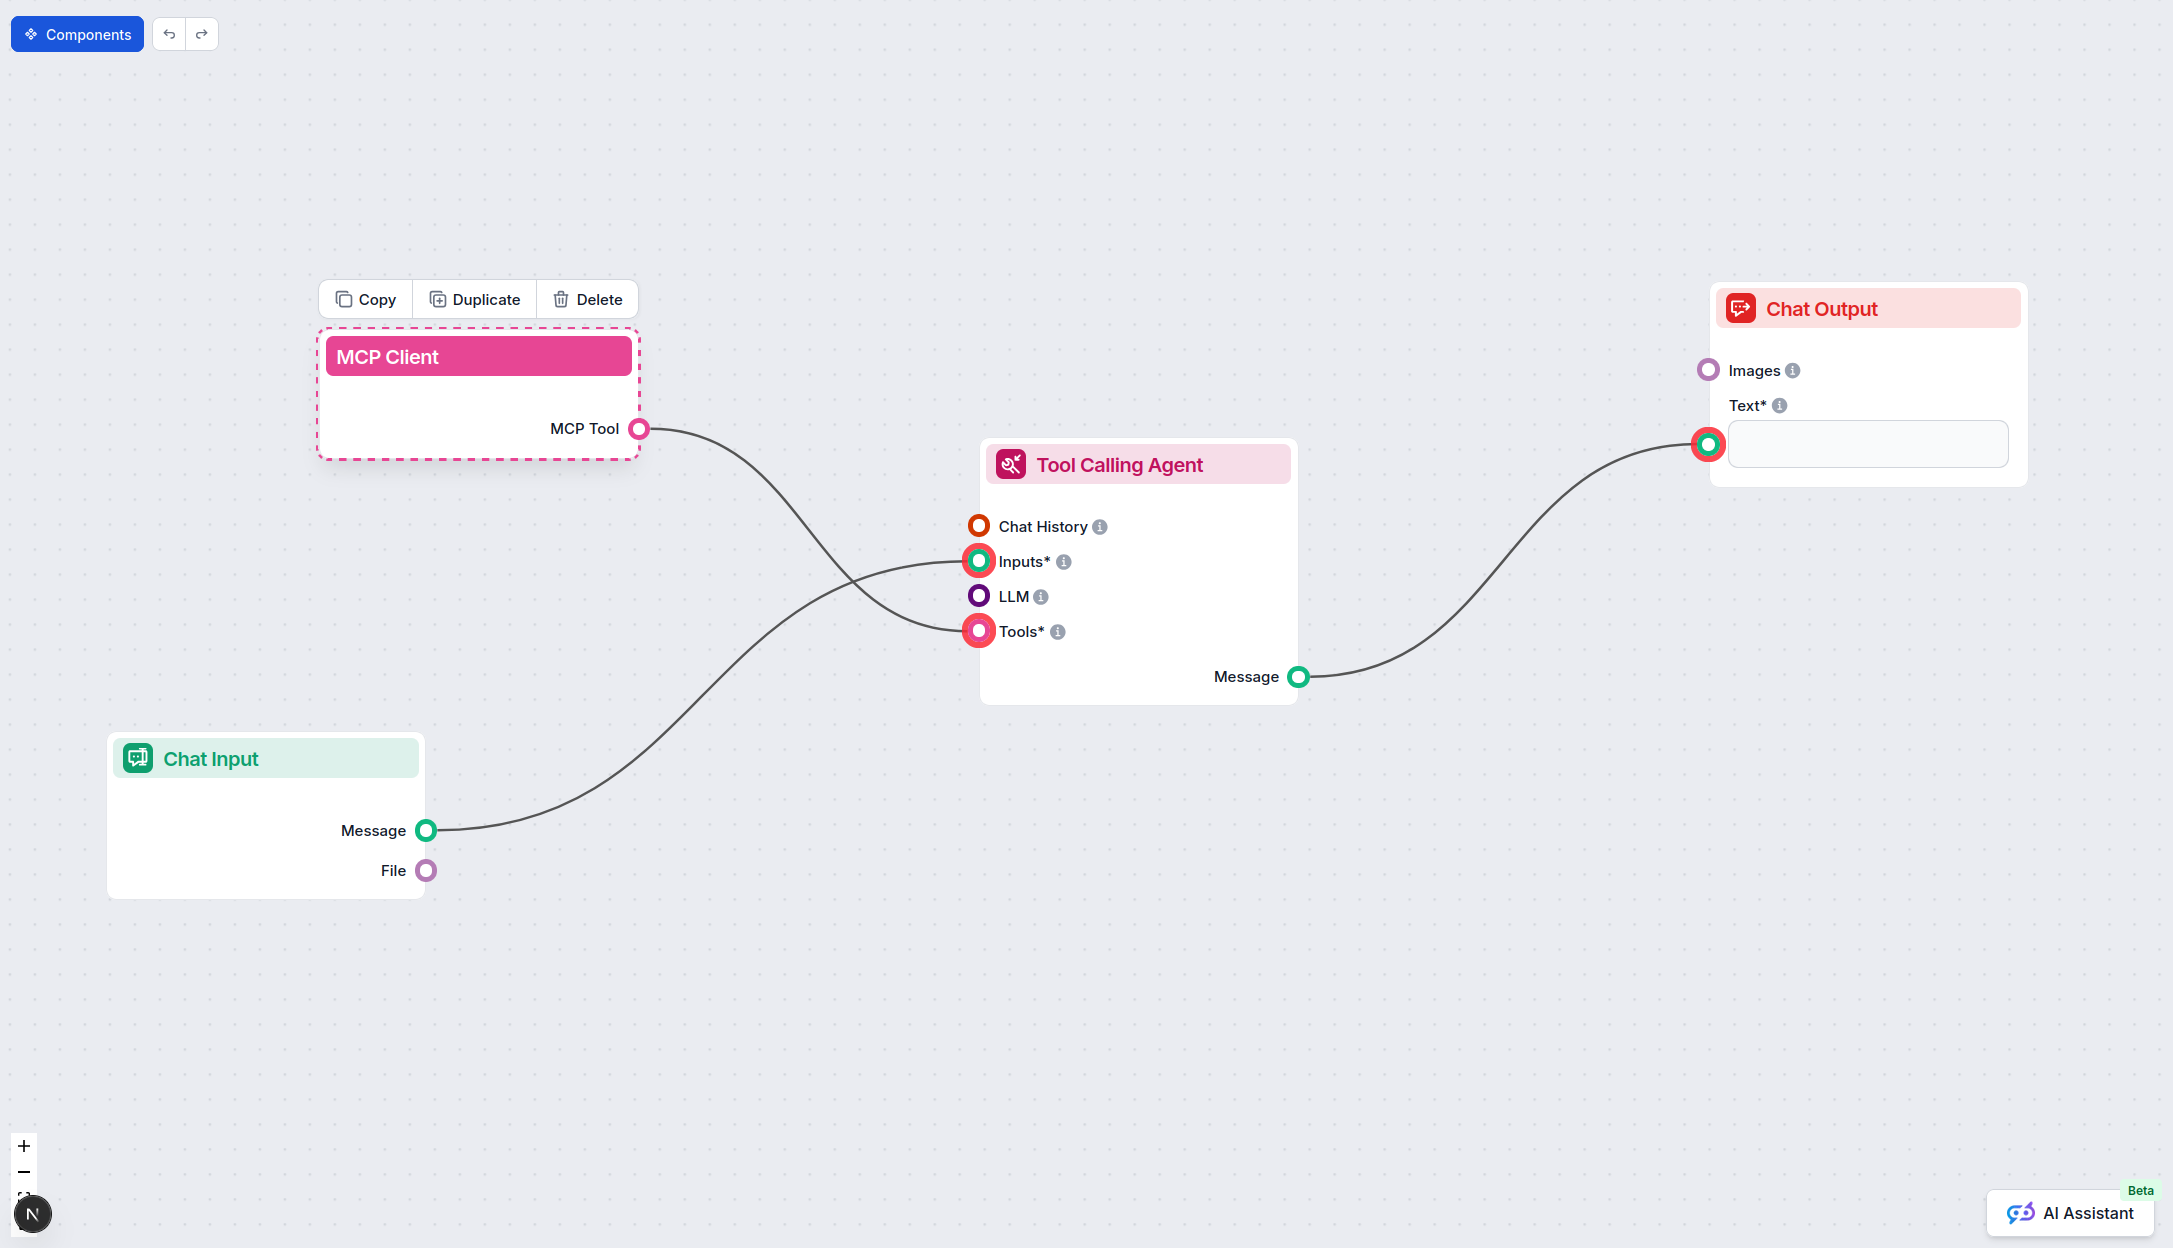
To integrate MCP servers into your FlowHunt workflow, start by adding the MCP component to your flow and connecting it to your AI agent:
Click on the MCP component to open the configuration panel. In the system MCP configuration section, insert your MCP server details using this JSON format:
{
  "prometheus": {
    "transport": "streamable_http",
    "url": "https://yourmcpserver.example/pathtothemcp/url"
  }
}
Once configured, the AI agent is now able to use this MCP as a tool with access to all its functions and capabilities. Remember to change “prometheus” to whatever the actual name of your MCP server is and replace the URL with your own MCP server URL.
Overview
| Section | Availability | Details/Notes |
|---|---|---|
| Overview | ✅ | Prometheus MCP Server enables PromQL queries and analytics |
| List of Prompts | ⛔ | No prompt templates listed |
| List of Resources | ⛔ | No explicit MCP resources described |
| List of Tools | ✅ | PromQL queries, metric listing, metadata, instant/range queries |
| Securing API Keys | ✅ | Environment variable usage detailed |
| Sampling Support (less important in evaluation) | ⛔ | Not specified |
Based on the above, Prometheus MCP Server offers strong tool integration and clear API key security. Some advanced MCP features (like prompts, explicit resources, sampling, and roots) are not documented or implemented.
Our opinion
The Prometheus MCP Server scores well for core MCP tool support and practical integration, but lacks documentation or implementation for prompts, resources, and advanced MCP features. It is reliable for metric analysis but not a full-featured MCP example. Score: 6/10.
MCP Score
| Has a LICENSE | ✅ (MIT) |
|---|---|
| Has at least one tool | ✅ |
| Number of Forks | 22 |
| Number of Stars | 113 |
Frequently asked questions
- What is the Prometheus MCP Server?
The Prometheus MCP Server is a Model Context Protocol implementation that lets AI assistants connect to and interact with Prometheus metrics using standardized tools. It supports PromQL queries, metric discovery, metadata retrieval, and time-series analytics to automate monitoring and DevOps workflows.
- Which tools does the Prometheus MCP Server provide?
It enables direct execution of PromQL queries, listing of available metrics, fetching of detailed metric metadata, and viewing of both instant and range query results for time-series data.
- What are the main use cases for this server?
Key use cases include automated infrastructure monitoring, DevOps analytics, incident triage, AI-driven dashboard generation, and security or compliance auditing—all via AI assistants connected to Prometheus.
- How do I securely configure Prometheus access?
Sensitive values such as Prometheus URLs, usernames, and passwords should be set using environment variables in your server configuration, reducing risk of accidental exposure.
- Does the Prometheus MCP Server support prompt templates or explicit MCP resources?
No, the current implementation does not document prompt templates or explicit MCP resources. Its strength is in tool integration for metric analysis.
- How can I use this MCP inside FlowHunt flows?
Add the MCP component to your flow, open its configuration, and insert your MCP server details using the provided JSON format. This allows your AI agent to access all Prometheus MCP functions programmatically.
Integrate Prometheus Metrics with Your AI Workflows
Empower your AI agents to query, analyze, and automate infrastructure monitoring using the Prometheus MCP Server. Try it in FlowHunt or book a demo to see it in action.
Learn more

